IODA Adds New Time Slicer Feature!
Overview
The IODA team is constantly working to improve usability of the dashboard and has just released a new feature called the time slicer that helps our users see a longer time view of IODA’s connectivity signal behavior. Additionally, we have a new export feature that allows you to export a time series view of connectivity signals to a png, jpeg, or svg. For inquiries or feedback please contact the IODA team at Georgia Tech’s Internet Intelligence Lab at ioda-info@cc.gatech.edu.
Time Slicer
The Internet Intelligence Lab at Georgia Tech is excited to announce the new time slicer feature. When we work with users to train them on how to use the dashboard, we always remind them to take a look at more than the default, 24-hour view, so that they can understand the normal behavior or patterns of IODA’s signals.
For example, the Active Probing and Telescope signals both demonstrate a diurnal pattern, which simply means the signals’ values increase during the day and decrease at night. This behavior is due to humans turning machines on the network off and on from night to day. In comparison, IODA’s BGP signal remains at a constant value and does not fluctuate. Users who are not familiar with IODA signals’ typical behavior may look at the default 24-hour period and assume a normal, nightly dip in Active Probing or Telescope is an abnormal drop,indicating an outage. For this reason, we have added the time slicer to help users with time comparison.
A few helpful details on the Time Slicer
The Time Slicer is configured to show users the historic equivalent of what they have selected in the time series. So if you choose to view signals in the past 24 hours, the time slicer will display the past 48 hours. If you select 7 days, the time slicer will show you the 7 day period before in addition to the dates selected.
The API does however have a 90 day limit, so if you select 60 days in the time range, the time slicer will show you the 60 days selected and an additional 30 days previous. Similarly, if you select 90 days worth of data, the same 90 days will appear in the time slicer.

How to interact with the Time Slicer
The Time Slicer is interactive. Take a look at the short video linked above to see the live action interactivity described here. The Time Slicer’s blue highlighted area corresponds to the time frame and data seen in the main time series chart. You can click and drag the blue highlighted area along the Time Slicer to change which data is viewed in the main time series chart. You can also make the blue highlighted area larger or smaller by clicking and dragging the edges to the desired time frame.
Time Series Export
IODA loves to be shared! You can now export the main time series chart and the time slicer by clicking the menu button in the upper right hand corner of the chart and selecting which file format to download. The downloaded image will include the time series view, the time slicer view, the name of the country/region/AS, and the date range. The file name will also include the name of the country/region/AS and the date.
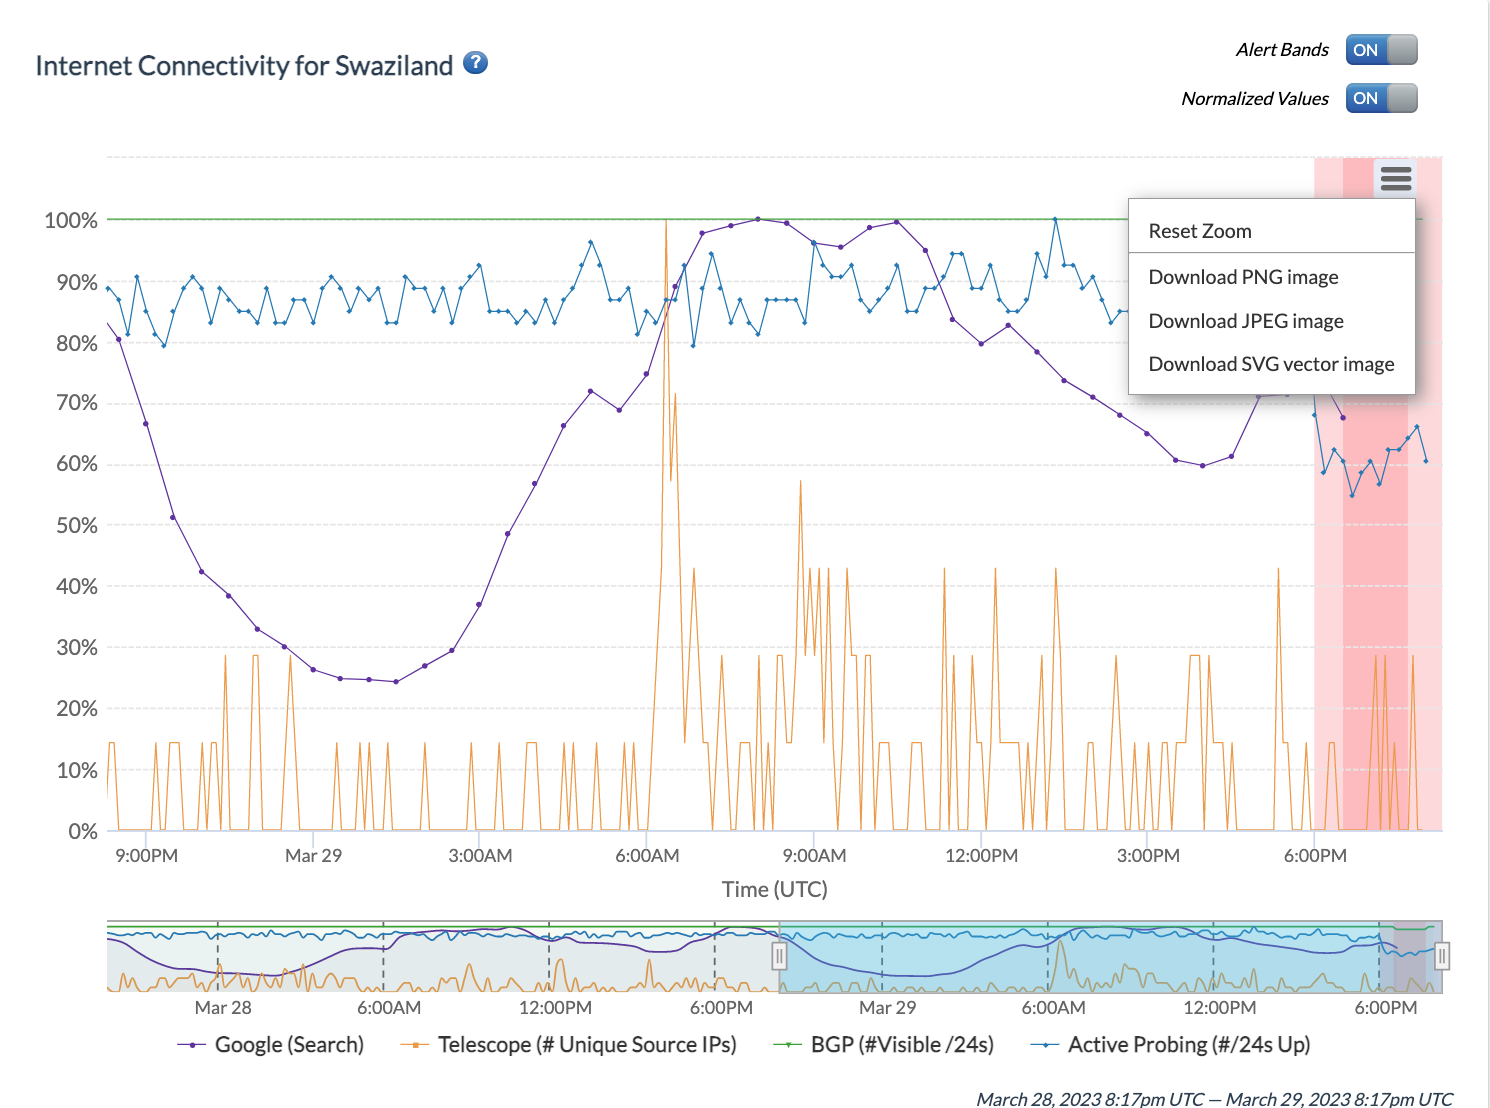
Selecting the menu button provides users with the option to download a PNG, JPEG, or SVG image of the time series and time slicer.
Gratitude
We would like to thank the IODA team for their hard work: Arvin, Alberto, Zach, Shane, Rameez, and Amanda.