IODA Integrates Google Usage Data and Adds Enhancements to the User Interface
The IODA team would like to share three exciting enhancements to the dashboard. First, we have integrated Google usage data. Second, we have implemented a Simplified and Advanced version of the dashboard. And finally, we have started the work of translating IODA into Farsi in partnership with the Miaan Group. Look for future improvements to this translation. We are excited to provide users with additional signals to interpret Internet connectivity. Please read more about the signals related to google usage data, our new Simplified and Advanced views, and the ongoing translation work below. For inquiries or feedback please contact the IODA team at Georgia Tech’s Internet Intelligence Lab at ioda-info@cc.gatech.edu.
GTR Signals
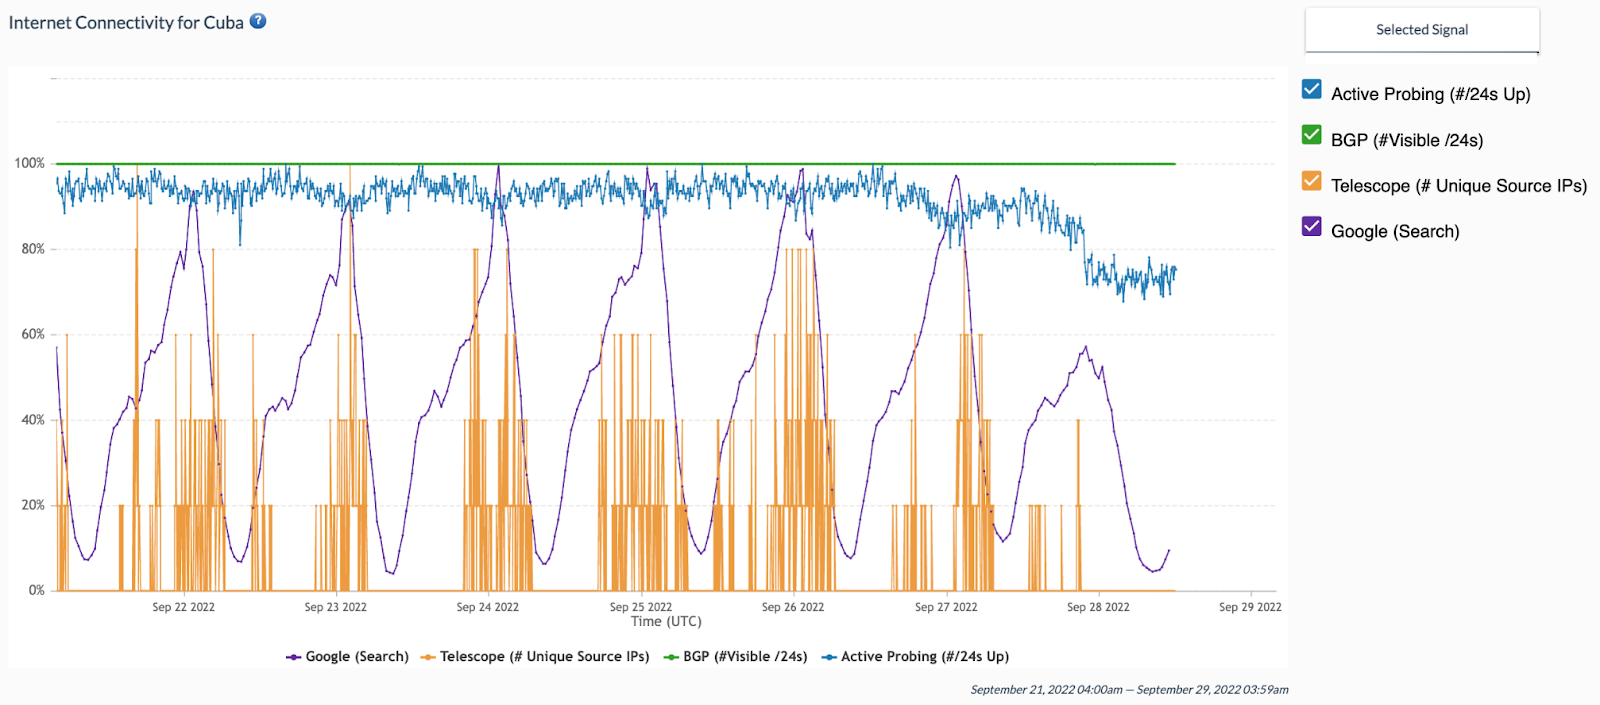
The Internet Intelligence Lab at Georgia Tech is excited to announce the integration of Google Transparency Report (GTR) data into IODA! At the country level, IODA users can now see Internet connectivity signals (BGP, Active Probing, Telescope) alongside Google products’ usage data (Google Search, YouTube, Maps, ...). We are grateful to the GTR team for providing this data and to the Jigsaw team for developing and maintaining the API service.
A few helpful details on the GTR signals
Google product signals are sourced from the Google Transparency Report. Each product signal represents normalized values of the number of visits to that Google product and are approximately geolocated to the country where the visit originated. IODA retrieves the Google Transparency Report data through the GTR API maintained by Jigsaw.
Current GTR data is only available at the country level and has a resolution of 1 data point per 30 minutes. IODA fetches the data every 15 minutes. You will notice a lag of 60-90 minutes in the time series.
How to interact with the GTR signal in IODA
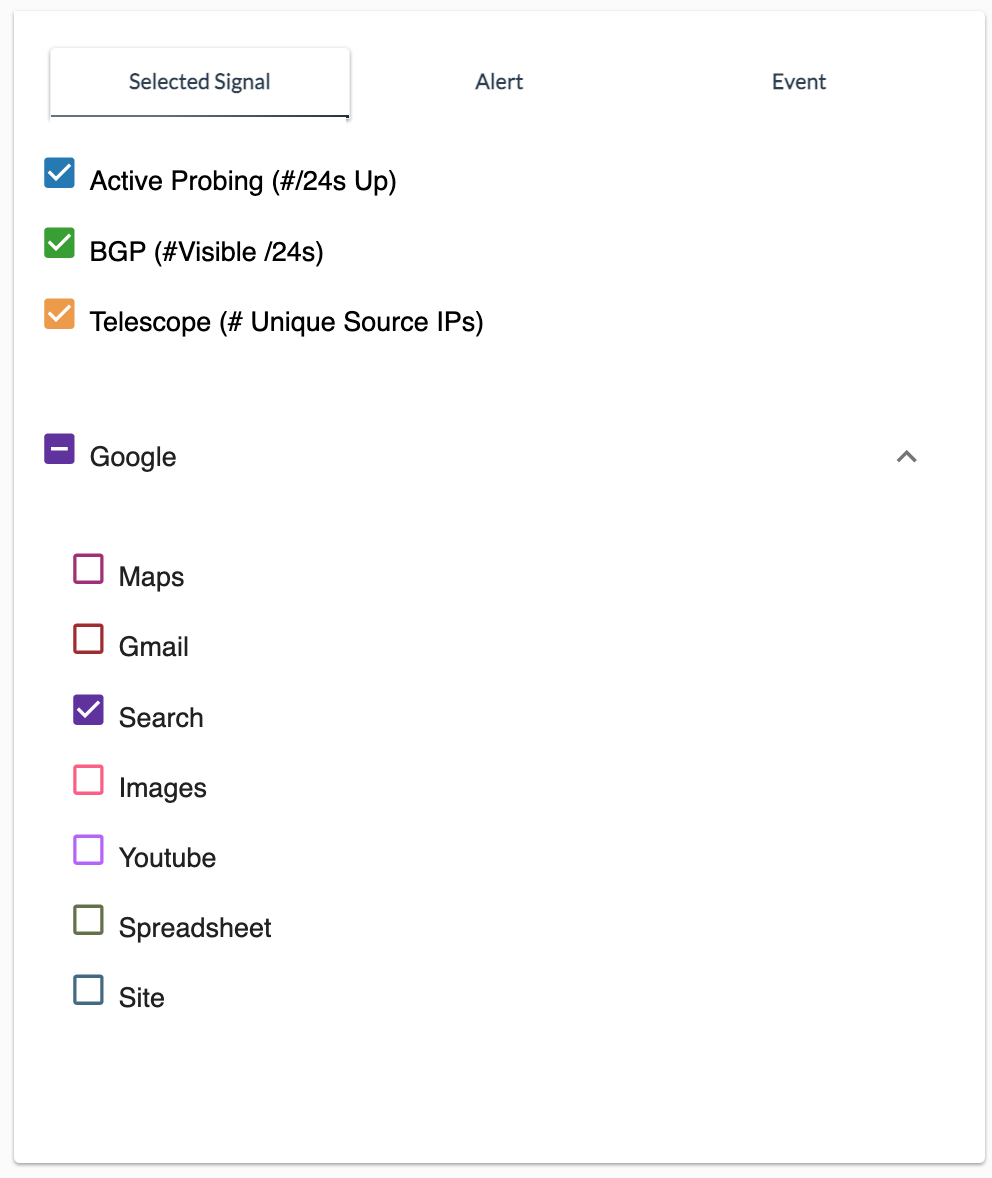
By default, IODA visualizes Google Web Search usage data. If you are in the Advanced View you can use the Selected Signal checkboxes to the left of the Google products to add and remove signals from the chart. (Please see more on the Advanced versus Simplified views below.)
New Simplified and Advanced Dashboard Views
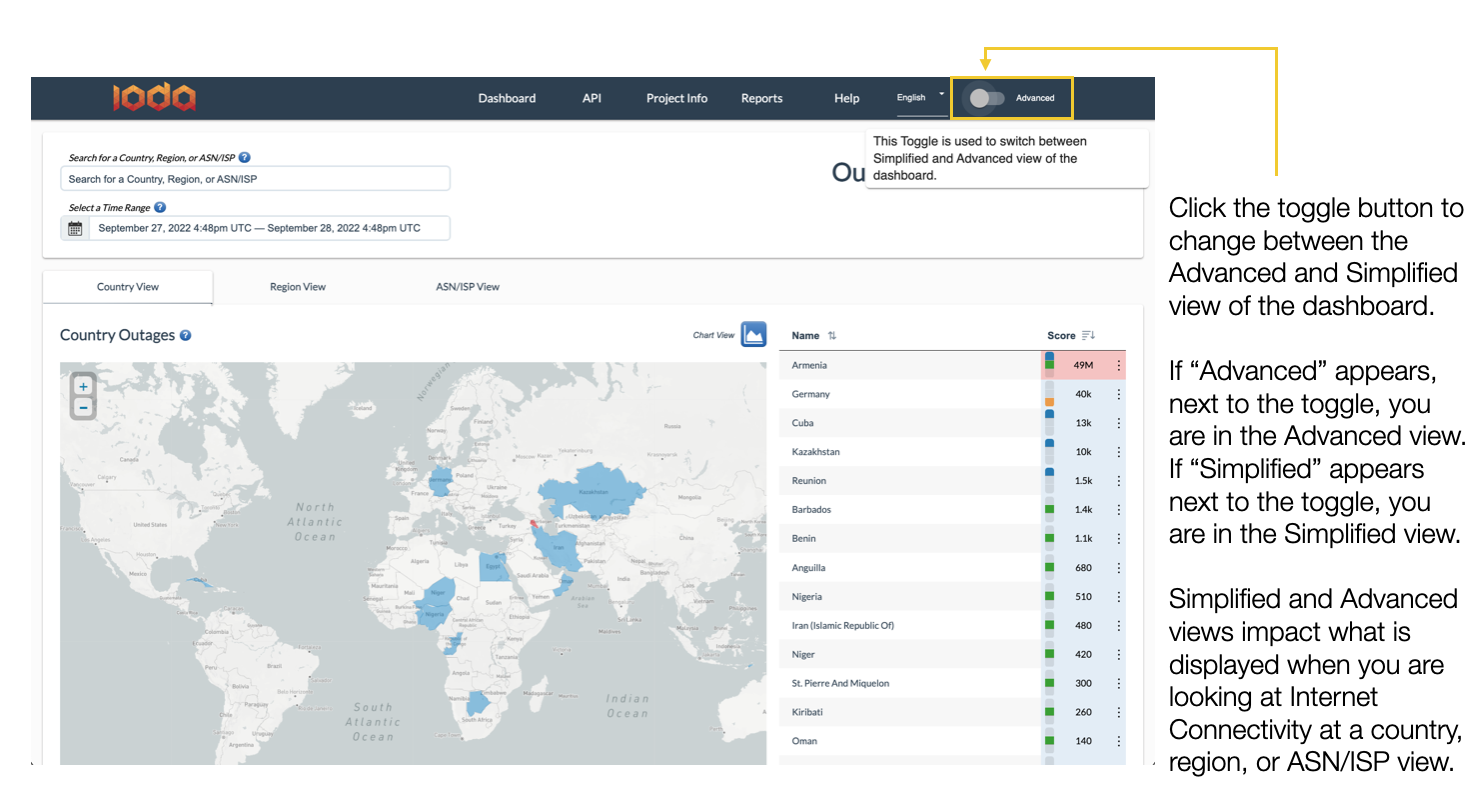
In addition to the GTR signal integration, you will notice there is now a Simplified and Advanced version of the dashboard that users can toggle between. This a first iteration of a simplified view to make IODA’s dashboard more intuitive to users less familiar with IODA. By default, the dashboard will be in Simplified view. Use the toggle in the upper righthand corner to switch views from Simplified to Advanced.
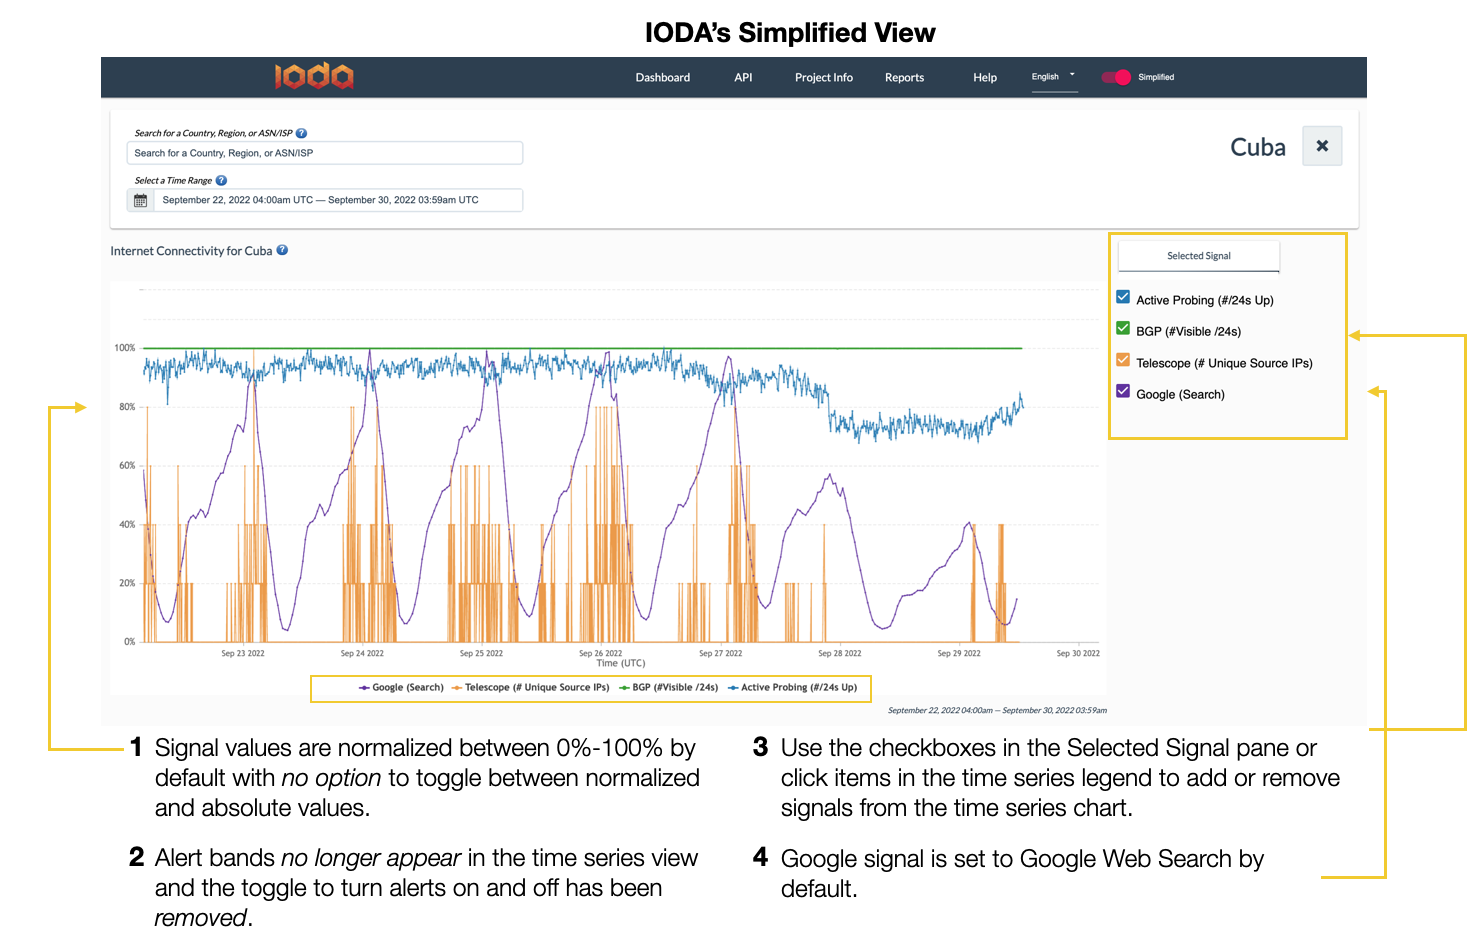
The Simplified View
By default, users will see the Simplified view. The toggle will appear red and will have the word “Simplified” next to it to let you know you are viewing the simplified dashboard.
Rundown on what you will see (and not see) in the Simplified view:
- Values in the timeseries chart are normalized and the option to toggle between normalized and absolute values has been removed
- The Alerts and Events tables have been removed and alert bands have been removed along with the toggle to turn alert bands on and off
- We find that our currently-unsophisticated alert system to be distracting for our users as it still produces false positives and false negatives. This feature is a work in progress and should be treated as such, and thus we expose it only in the Advanced view.
- The Selected Signal pane allows you to add or remove signals by checking or unchecking the boxes to the left of the signal name.
- You can still use the time series legend to add or remove signals
- In the Simplified view, the GTR signal by default shows web search traffic. In the advanced view, web search is still the default but you can use the signal selection pane to turn various GTR and IODA signals on and off.
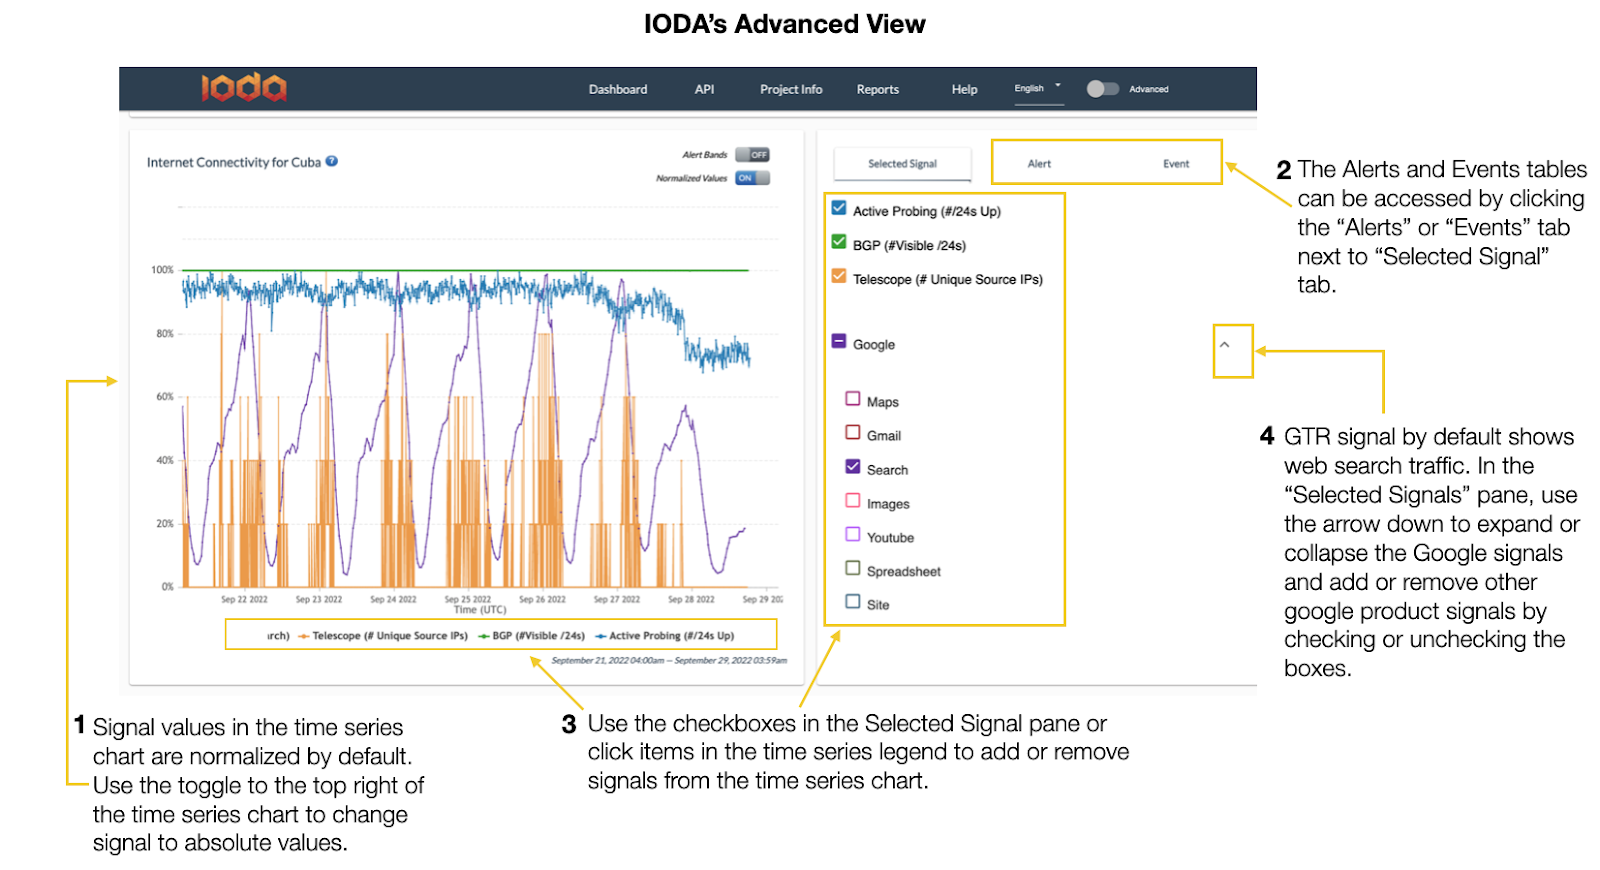
The Advanced View
As mentioned, the Advanced view can be accessed through the toggle on the upper righthand corner. If you are in the Advanced view, you will see the word “Advanced” next to the toggle.
Rundown on what you will see (and not see) in the Advanced view:
- Signal values in the time series chart are normalized by default. Use the toggle to the top right of the time series chart to change signal to absolute values.
- The Alerts and Events tables can be accessed by clicking the “Alerts” or “Events” tab next to “Selected Signal” tab.
- Use the checkboxes in the Selected Signal pane or click items in the time series legend to add or remove signals from the time series chart.
- GTR signal by default shows web search traffic. In the “Selected Signals” pane, use the arrow down to expand or collapse the Google signals and add or remove other google product signals by checking or unchecking the boxes.
IODA Translation to Farsi
In partnership with the Miaan Group, the IODA team began a translation of the dashboard to Farsi. Translation efforts are ongoing. Please reach out if you would like to help support IODA localization.

Gratitude:
We would like to thank the IODA team for their hard work: Akash, Alberto, Zach, Shane, Rama, and Amanda.
We would also like to thank our partners at the Miaan Group for supporting the Farsi translation and the GTR and Jigsaw team for making access to Google products’ usage data possible.